A gerrymandering analysis tool used to redraw district lines based on numerous heuristics centered around fairness.
- A zoomable, pannable map of the United States with display for multiple states.
- Full breakdown of demographic and election data on the state, district and precinct levels.
- Multiple map filters to display chloropleth for different measures.
- A multi-phase breakdown for districting analysis.
- Phase 0 - vote-block detection.
- Phase 1 - initial clustering based on multiple factors among intermediate clusters.
- Phase 2 - adjustment of clusters through swapping precincts to maximize objective function scores.
- Asynchronous updates for data while algorithm is running.
- Algorithm progress logging.
- ⚡ React - a JavaScript library for building UIs.
- 🏬 Redux - a predictable state container for JS apps.
- 🍃 Leaflet - an open-source JavaScript library for mobile-friendly interactive maps.
- 🌠 StompJs - a STOMP over WebSocket client for Web browser or node.js. applications.
- 🌳 Spring Boot - a preconfigured version of Spring.
- 🐻 Hibernate - ORM for Java.
- 🐳 MySQL - open source RDBMS.
- Backend
- Preprocessing - coming soon.

Initial load of application.

Selection of state with data being loaded via websockets.

Map filter selection.
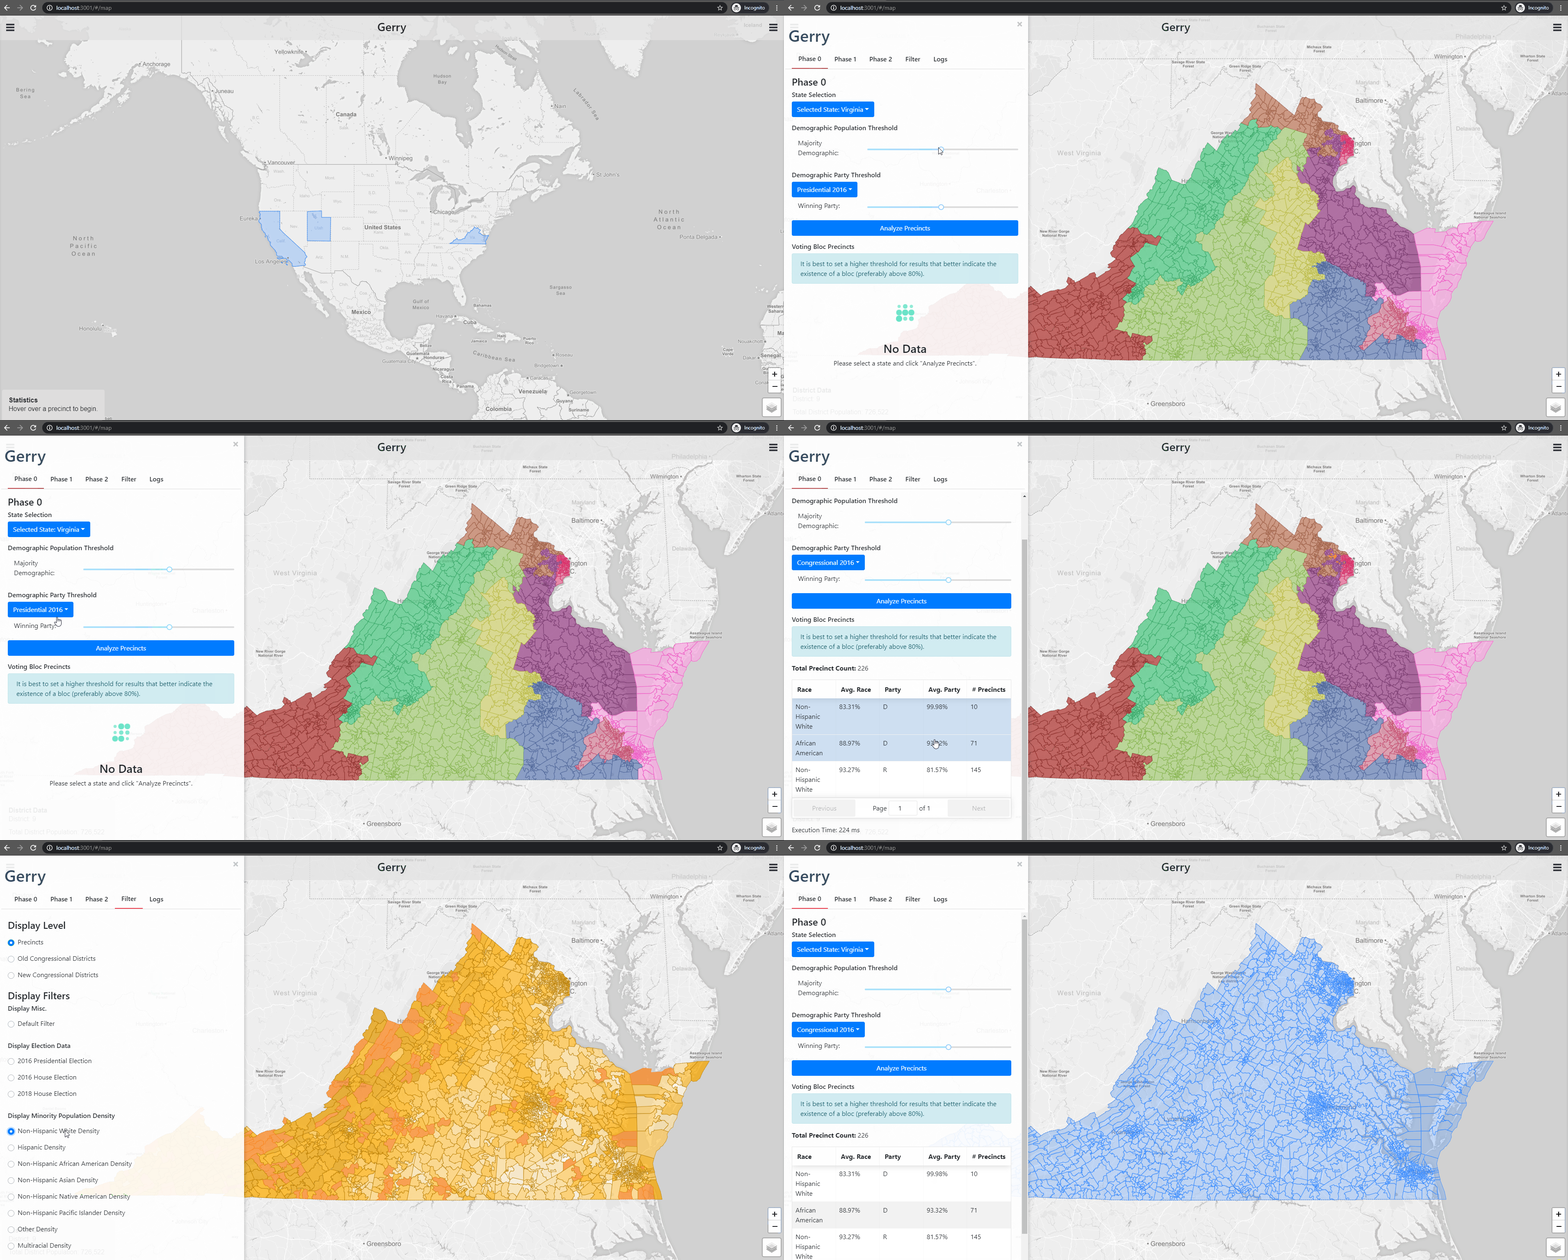
Execution of phase 0.

Execution of phase 1.
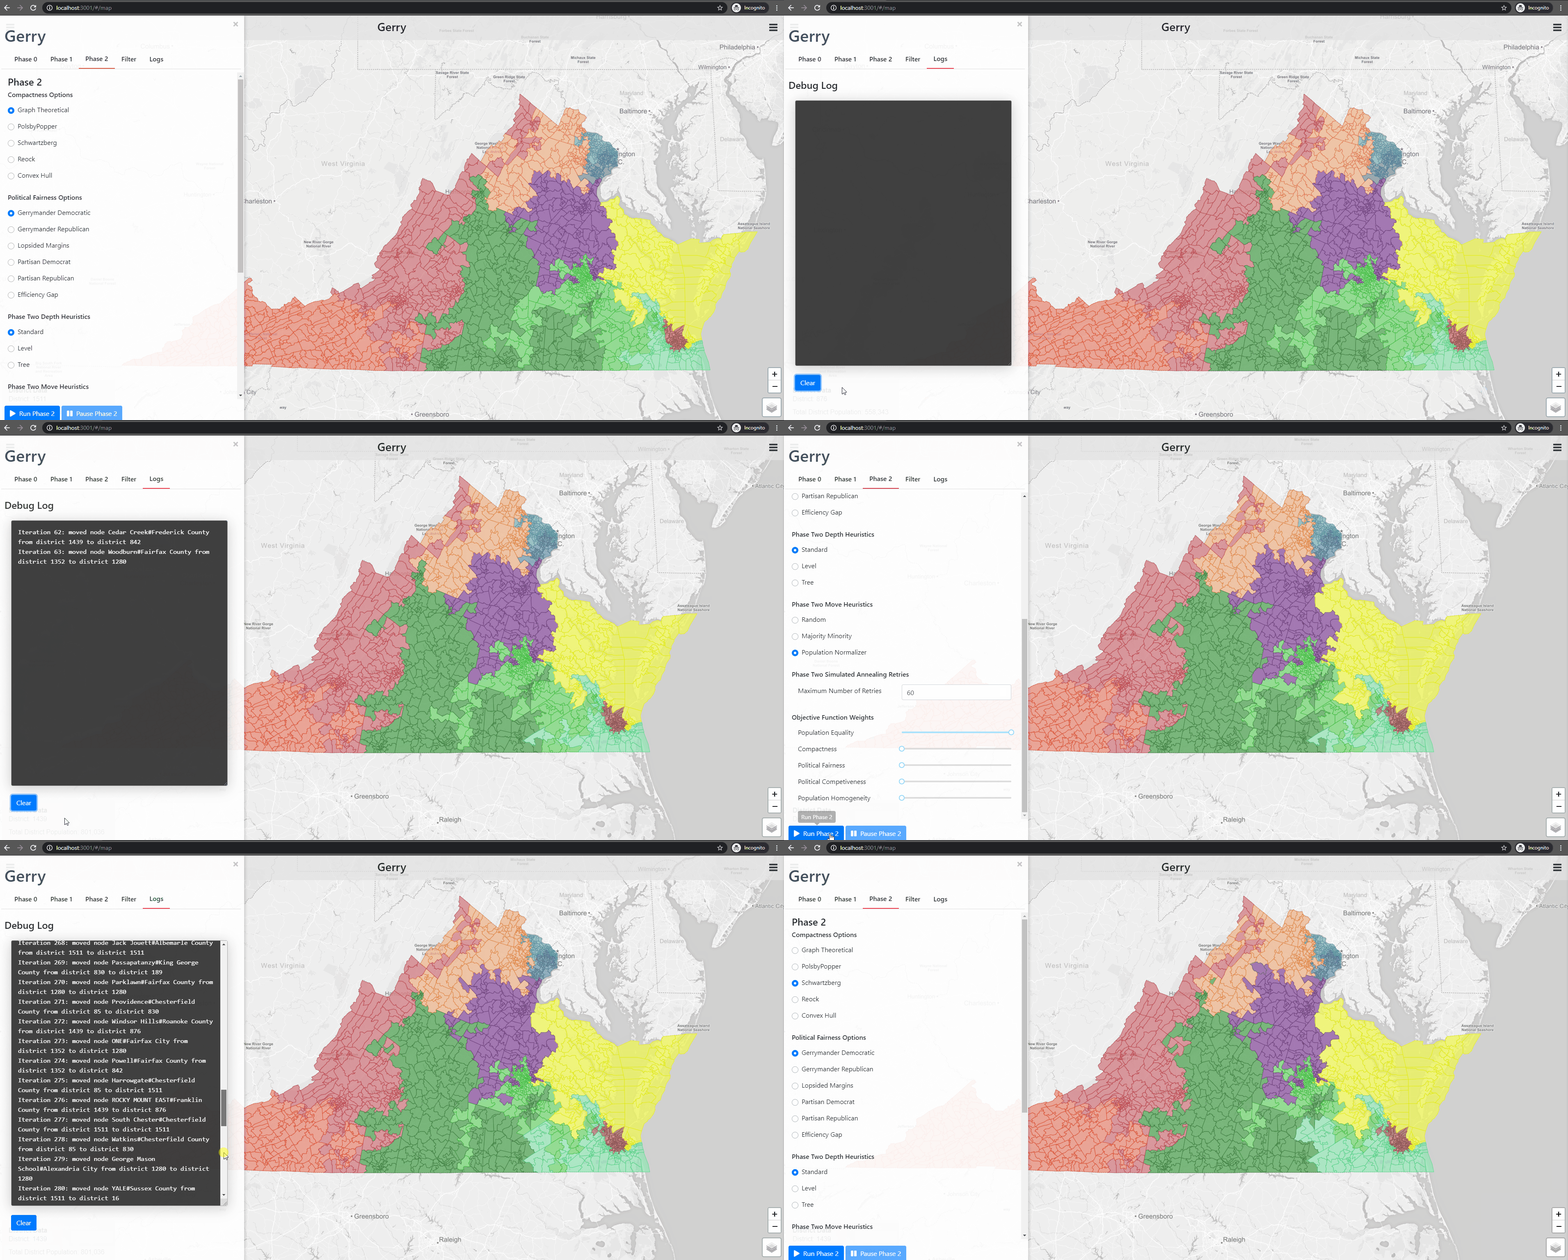
Execution of phase 2.

Displaying phase 2 results.

Executing iterative steps for phase 1 for California.
A live preview can be seen here.
Skip this setup if you are viewing the app through Netlify. First, install all needed dependencies.
npm iThen, start the application.
npm startTo test with a mock webserver, cd to ./server and start the server.
cd ./server && npm iThen, start the server.
npm start