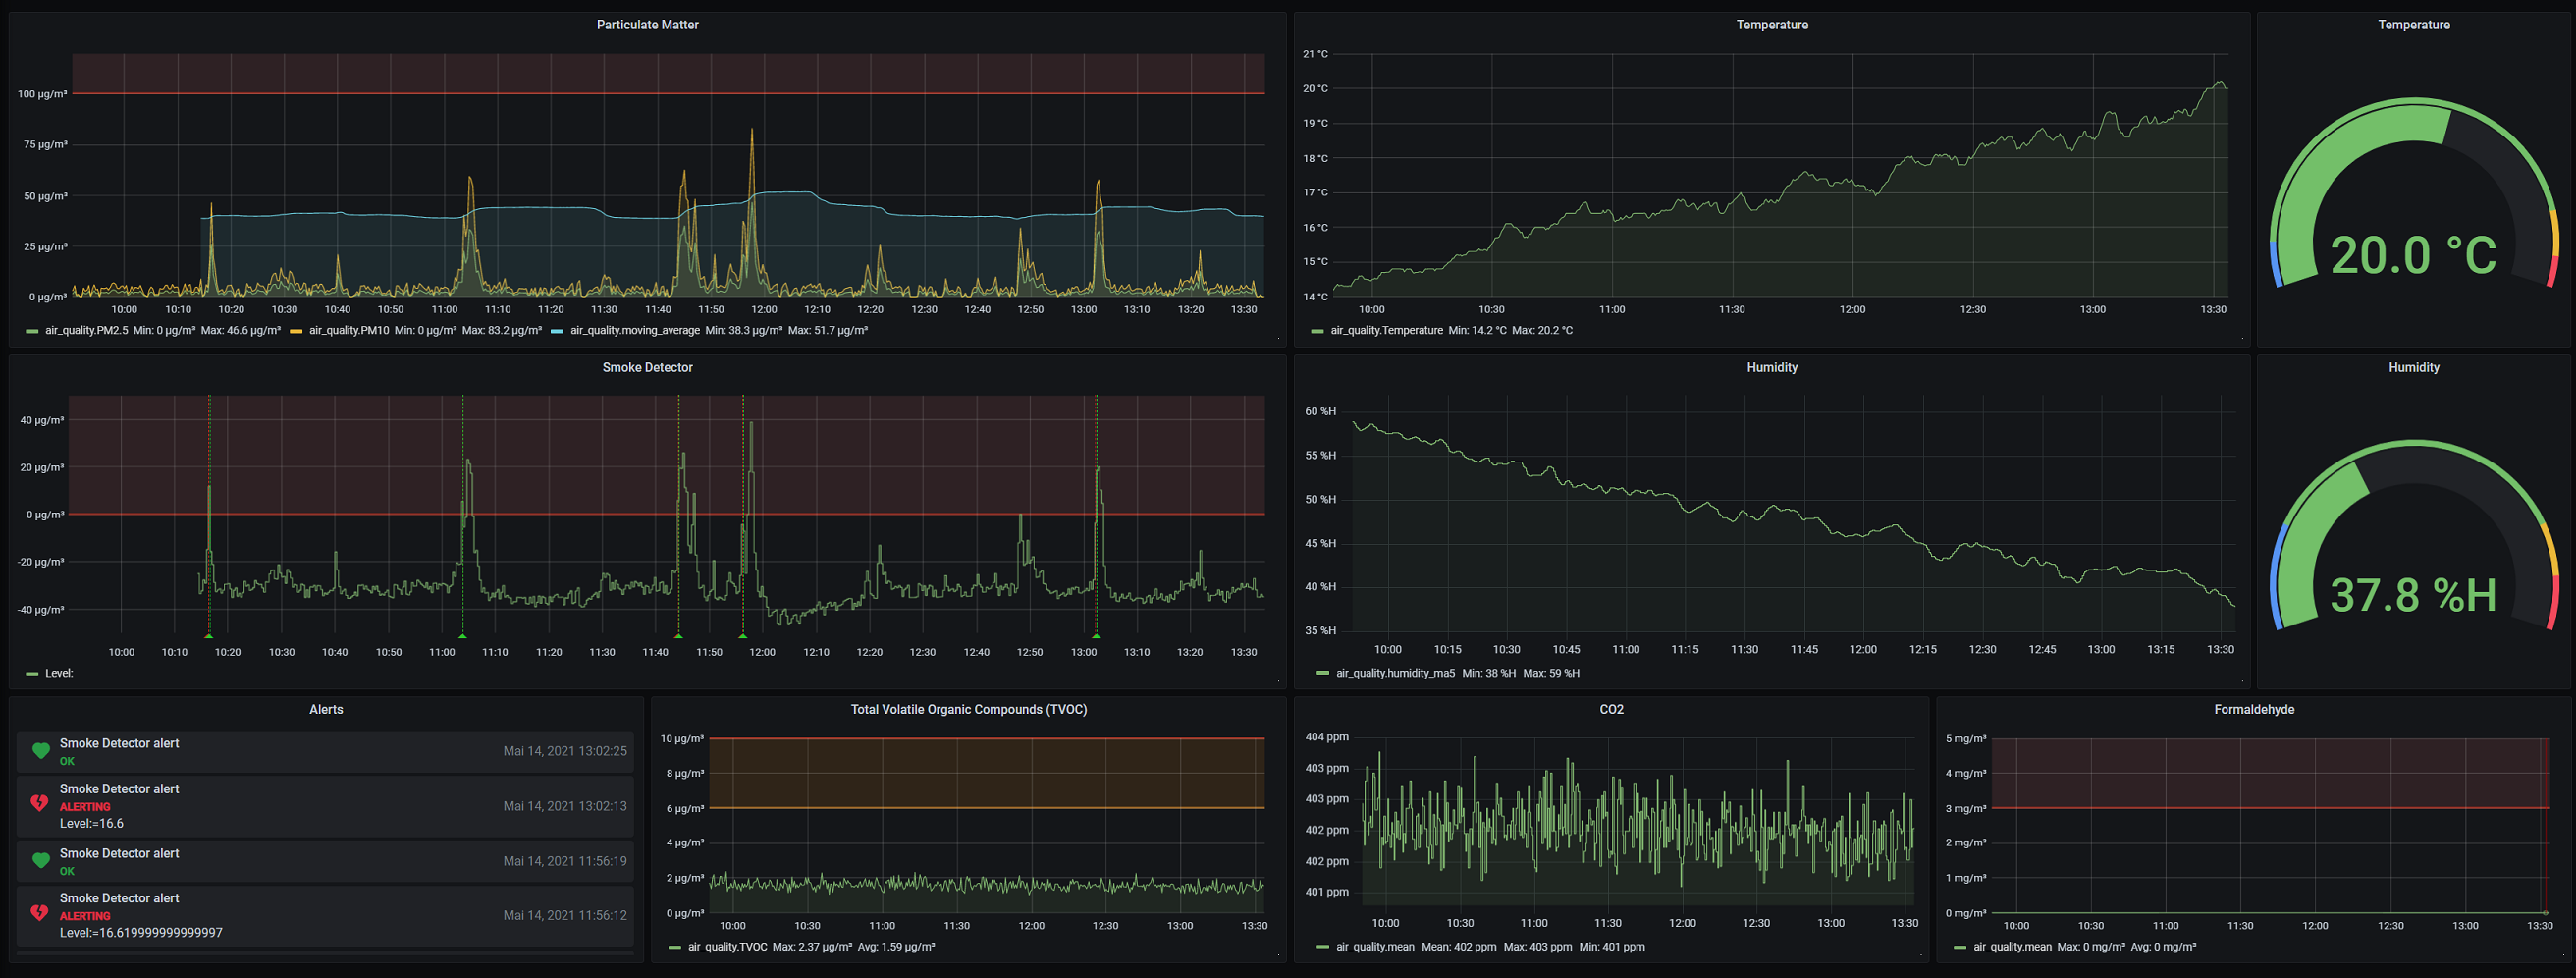
This app reads in data from a sensor, preprocesses it and stores it in an InfluxDB for visualization with Grafana. Monitors CO2, Temperature, Humidity, Particulate Matter/Dust Particles (2.5PM and 10PM) and more.
sudo su -
Start services: docker compose up -d
Show services: docker compose ps
Show collector logs: docker compose logs -f python_app
Check disk usage: du -hxs /var/lib/docker/ | sort -rh | head -n 40
Free disk space: docker system prune -a
InfluxDB stores raw sensor readings in short_term_retention for 4 weeks.
Long-term history is downsampled by the cq_air_quality_15m continuous query into
history_15m, which has infinite retention.
Grafana dashboards use the $retention variable. Use short_term_retention for
recent high-resolution data and history_15m for long time ranges.
Grafana datasource and dashboard provisioning live in grafana/provisioning.
The exported dashboard JSON lives in grafana/dashboards.
After editing the dashboard in the Grafana UI, export the live dashboard with the
Grafana API and replace grafana/dashboards/air-quality-dashboard.json before
committing.