Louise is a playwright. Her play, Fever, came close to its fundraising goal in a short amount of time relative to her personal expectations. Now, she would like greater perspective on how different campaigns fared relative to their launch dates, and funding goals. Kickstarter is a public benefit corporation that supports creatives, just like Louise. Through their global crowdfunding platform, projects materialize, and provide data. The project’s purpose, to leverage readily-provided data, discover hidden trends, and communicate findings to Louise. In practice, this included pulling, wrangling, and analyzing a Kickstarter dataset comprised of over 4,000 crowdfunded projects. With the data organized, powerful analyses and visualizations were performed to generate clear and accessible findings in the project report.
Assembling and cleaning the data within a PivotTable proved to be challenging here. To build a concise line chart, the data required organizing, filtering, sorting, and visualizing. Applying, the “Parent Category" and "Years” filters were self-explanatory given the simple concept there, however, grouping the "Row Labels" column to show the months of the year is a more complex task. The aforementioned columns did not initially appear with simply the months of the year. Post-experimenting with the subject PivotTable format, and leveraging online resources, all signs pointed toward the date inputs as “grouped” data - which needed to be “ungrouped”, selected, and dragged to exclusively show the month. While a simple workaround, this was a challenge nonetheless, and needed to be properly addressed in order to visualize the data.
Organizing the data in a time-efficient manner proved to be challenge on this one. The drawback here, spoke to the opportunity cost associated with taking the time to build excel foundational skills utilizing functions like, COUNTIFS(), and SUM(). Initially, creating a PivotTable/Chart, and filtering from the master dataset appeared perfectly sufficient. However, to meet the report deliverables, showcase from excel aptitude, and keep the selected data as versatile as possible - manual updates were needed. To reconcile, the COUNTIFS() function was applied to populate the "Number Successful," "Number Failed," and "Number Canceled" columns, based on the project "outcome," the "goal" amount using the goal ranges, and the Subcategory "plays”. While the SUM() function was applied on each row to add the "Number Successful," "Number Failed," and "Number Canceled" columns to populate the "Total Projects" column.
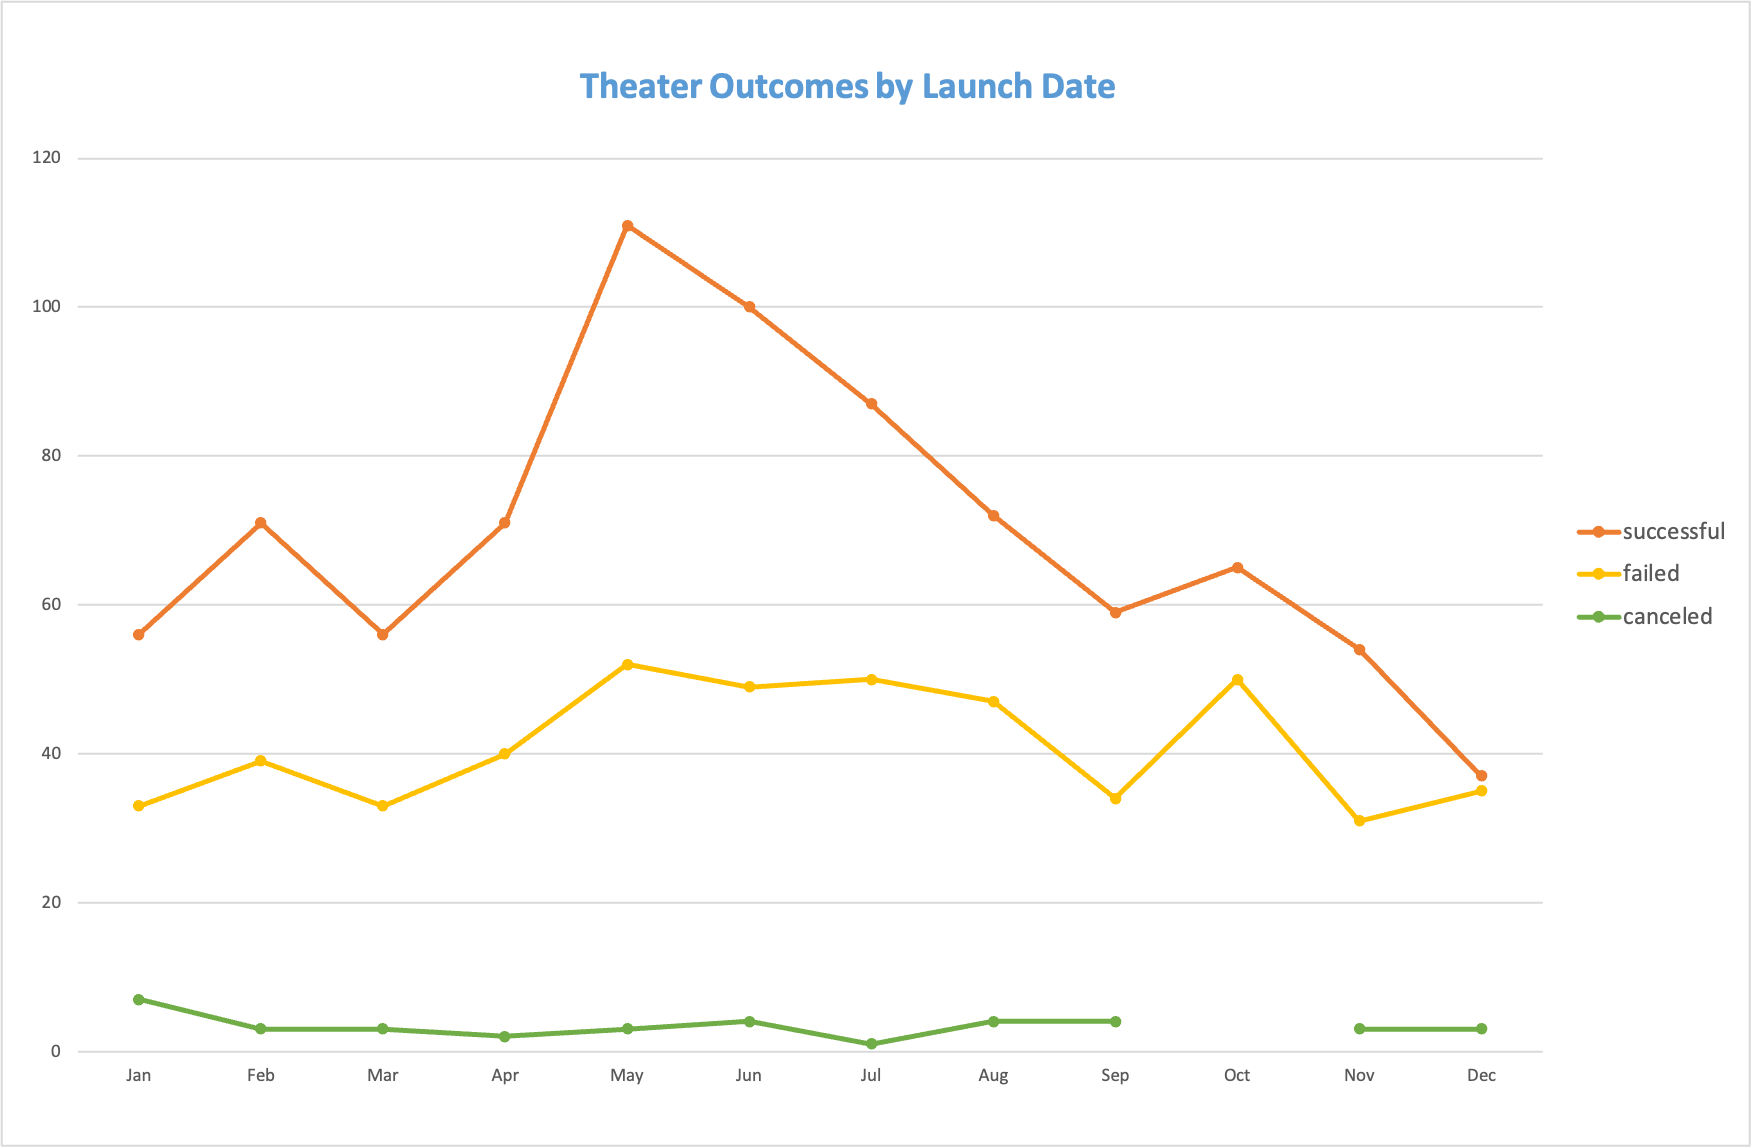
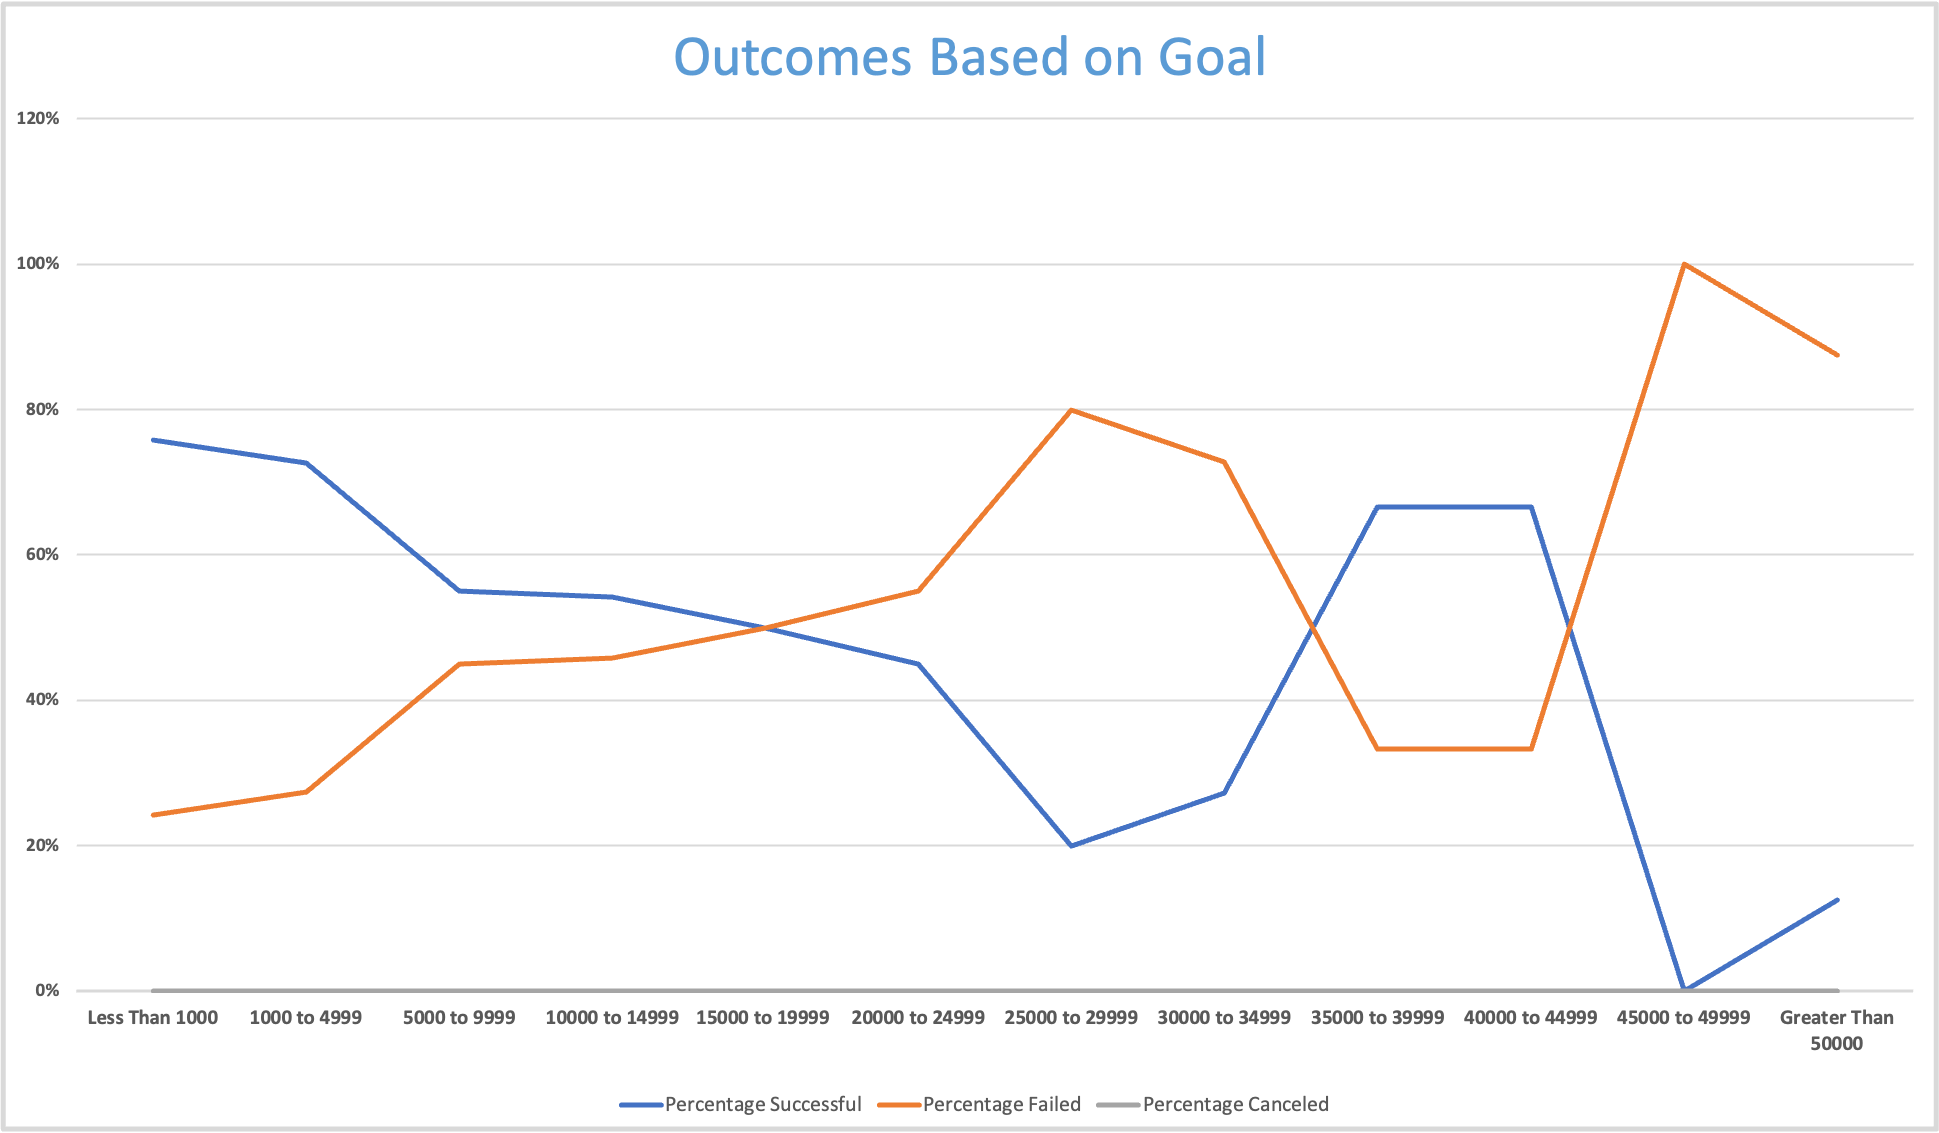
Upon further review of findings in the report, Outcomes based on Launch Date, data has indicated an uptick in the overall amount of both successful, and failed theater projects from months, April - May. More specifically, the, April - May, time span denotes the greatest increase in successful theater projects month-to-month - with the month of May marking peak of successful outcomes. With promising insights, also comes combatant ones. As we move further into the summer months, a steady decline indicates a strong drop-off in the overall amount of both successful, and failed theater projects with both almost coming to an identical low-point come the month of December. After reviewing the report, Outcomes based on Goals, data has indicated a tremendous disparity in percentage of failed, and successful outcome once entering the, 45,000 - 49,999 goal range. Adding more context, the aforementioned range also indicates the point at which likelyhood of succeeding is utterly dismal, while the chances of failing reach absolute heights. Furthermore, chances of successful outcome appear to be most favorable with coinciding goals between, Less Than 1,000 - 4,999 : 35,000 - 44,999.
There will always be limitations in any given dataset. This is no exception. Unless the dataset is very up-to-date, there will be a socioeconomic question mark staining the relevance of our findings. With COVID precautions, and even quasi-independent country/city/state-mandated protocols, it will be very challenging to provide Louise with deeper insights. Marketability for her play has most likely undergone a fundamental shift, not to say it’s an outright negative - but more so that it has changed since pre-pandemic life. All that being said, data compilation is taken more serious and is executed with more emphasis than anytime in the past. Provided time, resources, and patience…Louise could benefit from further analysis and research.
Comparing the report, Outcomes based on Launch Date, with a report, Outcomes based on End Date. To help Louise think more long-term, instead of fixating on when she needs to launch. Furthermore, comparing these could improve the clarity of data analysis being reported, and provide further insights on trends in seasonality, and outcomes.