

We provide several pre-configured Docker Compose environments to showcase different data platform setups. The summaries below offer a quick overview of each:
Kafka Development & Monitoring with Kpow
This stack provides a complete Apache Kafka development and monitoring environment, built using Confluent Platform components and enhanced with Kpow for enterprise-grade observability and management. It includes a 3-node, Zookeeper-less Kafka cluster running in KRaft mode, Schema Registry, Kafka Connect, and Kpow itself.
This architecture is designed for developers and operations teams who need a robust, local Kafka ecosystem for building, testing, and managing Kafka-based applications. By leveraging Kafka's KRaft mode, it offers a simplified, more efficient, and modern setup without the dependency on ZooKeeper. It features high availability (3 brokers), schema management for data governance, a data integration framework (Kafka Connect), and a powerful UI (Kpow) for monitoring cluster health, inspecting data, managing topics, and troubleshooting.
It's ideal for scenarios involving event-driven architectures, microservices communication, data integration pipelines, and situations requiring deep visibility into Kafka internals.
- Container:
kpowfrom (factorhouse/kpow:latest) - An engineering toolkit providing a rich web UI for comprehensive Kafka monitoring, management, and data inspection. Kpow gathers Kafka resource information, stores it locally in internal topics, and delivers custom telemetry and insights. Features include:
- Comprehensive Real-time Kafka Resource Monitoring: Instant visibility of brokers, topics, consumer groups, partitions, offsets, and more. It gathers data every minute, with a "Live mode" for real-time updates and requires no JMX access.
- Advanced Consumer and Streams Monitoring: Visualize message throughput and lag for consumers with multi-dimensional insights.
- Deep Data Inspection with kJQ: A powerful JQ-like query language to search messages at high speed, supporting JSON, Avro, Protobuf, and more.
- Schema Registry & Kafka Connect Integration: Full support for controlling and monitoring Schema Registries and Kafka Connect clusters.
- Enterprise-Grade Security & Governance: Supports Authentication (LDAP, SAML, OpenID), role-based access controls (RBAC), data masking policies, and a full audit log.
- Key Integrations: Includes Slack integration, Prometheus endpoints, and multi-cluster management capabilities.
- Exposes UI at
http://localhost:3000
- Kafka Brokers (
confluentinc/cp-kafka:8.1.1x3): Form the core message bus, now operating in KRaft (Kafka Raft Metadata) mode.- Zookeeper-less Architecture: This setup removes the need for a separate Zookeeper cluster. The brokers themselves handle metadata management and controller election through an internal consensus mechanism.
- Configured with distinct internal (
1909x) and external (909x,2909x) listeners for flexible Docker and Minikube networking. - Provides high availability and fault tolerance with a 3-node quorum.
- Accessible externally via ports
9092,9093,9094.
- Manages schemas (Avro, Protobuf, JSON Schema) for Kafka topics, ensuring data consistency and enabling schema evolution.
- Accessible at
http://localhost:8081. - Configured with Basic Authentication.
- Stores its schemas within the Kafka cluster itself.
- Framework for reliably streaming data between Apache Kafka and other systems.
- Accessible via REST API at
http://localhost:8083. - Configured to use JSON converters by default.
- Custom Connector Support: Volume mounts allow adding third-party connectors (e.g., JDBC, S3, Iceberg).
- OpenLineage Integration: Configured to send lineage metadata to a Marquez API, enabling data lineage tracking.
- Manages its configuration, offsets, and status in dedicated Kafka topics.
- Build and test Kafka producers, consumers, and Kafka Streams applications against a realistic, multi-broker KRaft cluster.
- Validate application behavior during broker failures (by stopping/starting broker containers).
- Utilize Kafka Connect to ingest data into Kafka from various sources or stream data out to data lakes, warehouses, and other systems.
- Test and manage connector configurations via the Connect REST API or Kpow UI.
- Define, register, and evolve schemas using Schema Registry to enforce data contracts and prevent breaking changes in data pipelines.
- Use Kpow to monitor cluster health, track topic/partition metrics, identify consumer lag, and inspect messages in real-time.
- Understand Kafka performance characteristics and troubleshoot issues within a controlled environment.
- Provides a self-contained environment to learn modern Kafka concepts, experiment with a Zookeeper-less configuration, and explore the capabilities of the Confluent Platform and Kpow.
Unified Analytics Platform with Flex, Flink, Spark, Iceberg & Hive Metastore
This stack builds a comprehensive analytics platform that erases the line between real-time stream analytics and large-scale batch processing. It achieves this by combining the power of Apache Flink, enhanced by Flex for enterprise-grade management and monitoring, with Apache Spark on a unified data lakehouse, enabling you to work with a single source of truth for all your data workloads.
This architecture is designed around a modern data lakehouse that serves both streaming and batch jobs from the same data. At its foundation, data is stored in Apache Iceberg tables on MinIO, an S3-compatible object store. This provides powerful features like ACID transactions, schema evolution, and time travel for your data.
A central Hive Metastore serves as a unified metadata catalog for the entire data ecosystem. By using a robust PostgreSQL database as its backend, the metastore reliably tracks all table schemas and metadata. This central catalog allows both Apache Flink (for low-latency streaming) and Apache Spark (for batch ETL and interactive analytics) to discover, query, and write to the same tables seamlessly, eliminating data silos. The platform also includes Redis, an in-memory data store, to facilitate high-speed data lookups and caching for real-time enrichment tasks.
The role of PostgreSQL is twofold: in addition to providing a durable backend for the metastore, it is configured as a high-performance transactional database ready for Change Data Capture (CDC). This design allows you to stream every INSERT, UPDATE, and DELETE from your operational data directly into the lakehouse, keeping it perfectly synchronized in near real-time.
The platform is rounded out by enterprise-grade tooling: Flex simplifies Flink management, a Flink SQL Gateway enables interactive queries, and a single node Spark cluster supports complex data transformations. This integrated environment is ideal for building sophisticated solutions for fraud detection, operational intelligence, and unified business analytics.
- Container:
flexfrom (factorhouse/flex:latest) - Provides an enterprise-ready tooling solution to streamline and simplify Apache Flink management. It gathers Flink resource information, offering custom telemetry, insights, and a rich data-oriented UI. Key features include:
- Comprehensive Flink Monitoring & Insights: Offers fully integrated metrics, long-term history, and aggregated consumption/production data, from cluster-level down to individual job-level details.
- Enterprise-Grade Security & Governance: Supports versatile Authentication (LDAP, SAML, OpenID), robust Role-Based Access Controls (RBAC), data masking policies, and a full audit log.
- Powerful Flink Enhancements: Includes multi-tenancy and multi-cluster monitoring capabilities.
- Key Integrations: Exposes Prometheus endpoints and allows for Slack notifications.
- Exposes UI at
http://localhost:3001
- JobManager (
jobmanager) coordinates all tasks, handles scheduling, checkpoints, and failover. Flink UI is exposed athttp://localhost:8082. - TaskManagers (
taskmanager-1,-2,-3) run user code and perform actual stream processing. - The cluster is configured to use the central Hive Metastore for catalog services and includes a rich set of connectors for Kafka, Iceberg, and more.
- Container:
sql-gateway - A REST-accessible endpoint (
http://localhost:9090) for interactive Flink SQL queries against the unified catalog.
- Container:
spark-iceberg - Provides an Apache Spark environment pre-configured with Apache Iceberg and OpenLineage support, connected to the central Hive Metastore.
- Spark Web UI for monitoring running jobs (
http://localhost:4040). - Spark History Server for reviewing completed jobs (
http://localhost:18080).
- Container:
hive-metastore - A central metadata service that allows both Flink and Spark to interact with the same Iceberg tables consistently.
- Uses the PostgreSQL database as its backend to durably store all metadata.
- Accessible internally at
thrift://hive-metastore:9083.
- Container:
postgres - Serves two critical functions:
- Durable Metastore Backend: Provides persistent storage for the Hive Metastore.
- Transactional Workload & CDC Hub: Functions as a relational database for application workloads, with
wal_level=logicalenabled for seamless Change Data Capture.
- Accessible at
localhost:5432.
- MinIO provides S3-compatible object storage, acting as the data lake storage layer for Iceberg tables and Flink checkpoints.
- MinIO API at
http://localhost:9000| MinIO Console UI athttp://localhost:9001(admin/password).
- MinIO API at
- MinIO Client (
mc) initializes MinIO by creating necessary buckets (warehouse,flink-checkpoints, etc.).
- Container:
redis - A high-performance in-memory key-value store that adds a low-latency data access layer to the platform.
- Purpose: Ideal for caching frequently accessed data, serving as a high-speed lookup table for stream enrichment in Flink, or acting as a serving layer for real-time application results.
- Configuration: Configured for persistence (
appendonly yes) and secured with a password. - Accessible at
localhost:6379.
- Create, manage, and query Iceberg tables using both Flink SQL for real-time writes and Spark for batch updates, all through the central Hive Metastore.
- Perform ACID-compliant operations from either engine on the same datasets.
- The architecture is purpose-built to support CDC pipelines. The
wal_level=logicalsetting in PostgreSQL allows tools like Debezium to capture every row-level change and stream it into the data lakehouse in near real-time.
- Use Spark to perform large-scale transformations on data within the lakehouse for reporting or machine learning.
- Ingest data from Kafka or CDC streams with Flink.
- Join streaming data with lookup tables in Redis for millisecond-latency enrichment.
- Write enriched, structured data directly into Iceberg tables, making it immediately available for Spark to query.
- Empower analysts to query live, streaming data via the Flink SQL Gateway and historical, large-scale data using Spark—all with familiar SQL pointed at the same tables.
Real-time Data Stores: Pinot, ClickHouse & StarRocks
This stack provides a flexible development environment featuring a choice of three powerful, high-performance data stores: Apache Pinot, ClickHouse, and StarRocks. Designed to be a showcase of modern data storage solutions, this configuration uses Docker Compose profiles to allow you to select and launch only the specific system you need for your real-time analytics workloads.
This architecture is designed for developers and engineers to explore and build applications on top of leading data technologies. The name compose-store.yml reflects its purpose as a catalog of specialized storage systems for enabling low-latency analytical queries on large datasets.
- Apache Pinot is purpose-built for user-facing, real-time analytics requiring sub-second query latency.
- ClickHouse is a general-purpose, high-performance OLAP database, deployed here with the HyperDX stack which provides a convenient web UI and ingestion endpoint to accelerate development.
- StarRocks delivers a modern, high-concurrency OLAP experience for a wide range of analytical workloads.
A standalone ZooKeeper service is included to provide the necessary coordination for the Apache Pinot cluster.
This stack is organized into three independent profiles. To launch a specific system, use the --profile flag (e.g., docker compose --profile pinot -f ./compose-store.yml up).
A distributed, real-time OLAP data store designed for ultra-low-latency analytics at scale.
- ZooKeeper (
zookeeper): Manages cluster state and coordination for Pinot. - Pinot Controller (
pinot-controller): The brain of the cluster, handling administration and schema management.- Admin UI/API:
http://localhost:19000
- Admin UI/API:
- Pinot Broker (
pinot-broker): The query gateway for clients.- Query Endpoint:
http://localhost:18099
- Query Endpoint:
- Pinot Server (
pinot-server): Hosts data segments and executes query fragments.
Deploys the powerful ClickHouse OLAP engine with a convenient UI and ingestion layer for building analytics applications.
- ClickHouse Server (
ch-server): The core of this profile. A high-performance, column-oriented DBMS designed for real-time analytical queries on massive datasets.- HTTP API:
http://localhost:8123
- HTTP API:
- HyperDX App (
ch-app): Provides a web UI and exploration tool for interacting with ClickHouse. Use it to run SQL queries, visualize results, and manage your analytics environment.- UI:
http://localhost:8081
- UI:
- HyperDX OTEL Collector (
ch-otel-collector): An example of a high-performance data ingestion endpoint (OpenTelemetry Collector) capable of feeding real-time data into ClickHouse. - MongoDB (
ch-db): A necessary dependency that acts as a metadata store for the HyperDX UI.
A next-generation, high-performance analytical data store designed for a wide range of low-latency OLAP scenarios.
- StarRocks Frontend (FE) (
starrocks-fe): Manages metadata, query planning, and client connections.- Admin UI:
http://localhost:8030 - MySQL-compatible SQL Endpoint:
localhost:9030
- Admin UI:
- StarRocks Backend (BE) (
starrocks-be): Responsible for storing data and executing the physical query plans with high performance.
- Real-Time Dashboards: Power interactive dashboards requiring millisecond query latency on constantly updating datasets.
- User-Facing Analytics: Embed analytics directly into applications where users can explore data with immediate feedback.
- Anomaly & Threat Detection: Query streaming event data in near real-time to identify patterns and outliers quickly.
- Real-Time Business Intelligence (BI): Power interactive dashboards and reports directly on raw, large-scale data without pre-aggregation.
- Interactive Big Data Analytics: Run complex, ad-hoc analytical queries on terabytes of data (e.g., web clickstreams, IoT sensor data, financial transactions) and get results in seconds.
- Log and Event Data Analysis: Build powerful search and aggregation systems on machine-generated data for operational intelligence or security analytics.
- Streaming Data Analytics: Ingest data from real-time sources like Kafka and make it available for immediate querying.
- Modern Data Warehousing: Serve as a high-performance core for a modern data warehouse, enabling fast BI reporting and low-latency dashboards.
- Ad-Hoc & Interactive Analytics: Empower analysts to run complex, exploratory queries on large datasets without long wait times.
- Unified Analytics: Query data from various sources, including data lakes, from a single, fast engine.
Data Lineage & Observability with OpenLineage and Prometheus
This Docker Compose stack provides two independent but complementary environments: a data lineage service powered by Marquez, and a complete telemetry and observability suite featuring Prometheus, Grafana, and Alertmanager. Through the use of Docker Compose profiles, you can launch either stack on its own, allowing you to use only the resources you need.
This architecture is designed for data professionals who need to understand their data's journey (lineage) and monitor the health of their systems (telemetry). It separates these concerns into two distinct profiles:
- The
lineageprofile deploys Marquez, the reference implementation of the OpenLineage standard. It collects metadata to build a living map of how datasets are produced and consumed, which is invaluable for impact analysis, data governance, and debugging complex data pipelines. - The
telemetryprofile deploys the industry-standard Prometheus/Grafana stack for comprehensive metrics, visualization, and alerting, ensuring the reliability and performance of your entire platform.
This stack is organized into two independent profiles. To launch a specific stack, use the --profile flag.
Launch this stack with docker compose --profile lineage -f ./compose-obsv.yml up -d.
marquez-api(marquezproject/marquez:0.51.1): The core Marquez backend service. It provides a RESTful API compliant with the OpenLineage standard, allowing it to receive metadata from integrated tools like Flink, Spark, and Airflow.marquez-web(marquezproject/marquez-web:0.51.1): The web interface for Marquez, which visualizes the collected OpenLineage data. It allows users to explore interactive data lineage graphs and trace the journey of their data.- UI is exposed on port:
3003
- UI is exposed on port:
marquez-db(postgres:14): A PostgreSQL database that serves as the backend for Marquez, storing all metadata on jobs, datasets, historical runs, and their relationships.
Launch this stack with docker compose --profile telemetry -f ./compose-obsv.yml up -d.
prometheus(prom/prometheus:v3.5.0): A time-series database that collects and stores metrics by scraping configured endpoints. It's configured to scrape metrics from other services in the ecosystem (like Kpow or Flink).- UI is exposed on port:
19090
- UI is exposed on port:
grafana(grafana/grafana:12.1.1): A leading visualization platform for creating dashboards from the metrics stored in Prometheus. This service is pre-configured to automatically provision datasources and dashboards.- UI is exposed on port:
3004(admin/admin)
- UI is exposed on port:
alertmanager(prom/alertmanager:v0.28.1): Manages alerts sent by Prometheus. It handles deduplicating, grouping, and routing alerts to notification channels like email or Slack.- UI is exposed on port:
19093
- UI is exposed on port:
💡 Note: You can launch both stacks using:
docker compose --profile lineage --profile telemetry -f ./compose-obsv.yml up -d- Automated Data Lineage & Provenance Tracking: Use OpenLineage integrations to automatically capture lineage metadata from your data pipelines. Visualize the origin, movement, and transformations of data across your ecosystem in the Marquez UI.
- Impact and Root Cause Analysis: When a pipeline fails or data quality issues arise, use the lineage graph in Marquez to quickly identify the upstream root cause and assess the downstream impact.
- Data Governance and Compliance: Maintain a detailed, historical record of dataset versions, schema changes, and job execution history, which is essential for auditing and understanding the data lifecycle.
- Centralized System Health Monitoring: Utilize Prometheus and Grafana to monitor the performance and health of your data services. Create dashboards to track API latency, database connections, and resource utilization.
- Proactive Alerting on System Issues: Configure alerts in Prometheus and Alertmanager to be notified of potential problems, such as high CPU usage, low disk space, or failed service health checks, before they impact your data consumers.
- Performance Analysis: Dive deep into time-series metrics to understand the performance characteristics of your data platform, identify bottlenecks, and optimize resource allocation.
Unified Data Discovery & Governance with OpenMetadata
This stack deploys OpenMetadata, an all-in-one open-source platform for data discovery, data lineage, data quality, observability, and governance. It provides a centralized metadata store, enabling teams to get a comprehensive view of their data assets. This entire environment is deployed under the omt profile.
This architecture is designed to create a single source of truth for all your data. OpenMetadata actively pulls metadata from a vast ecosystem of connectors (databases, data warehouses, BI tools, etc.) to build a rich, interconnected map of your data landscape.
Unlike systems that focus purely on lineage, OpenMetadata is a comprehensive data workspace. It allows users to not only see how data is created and used (lineage) but also to search for data across the entire organization (discovery), understand its meaning through a business glossary (governance), and verify its trustworthiness through data quality tests. It's the central hub for collaboration and understanding around data.
This stack is organized under a single profile. To launch it, use the command docker compose --profile omt -f ./compose-metadata.yml up -d.
omt-server(openmetadata/server): The heart of the platform. This service hosts the OpenMetadata UI, the central metadata API, and all the core logic for managing data assets.- UI is exposed on port:
8585
- UI is exposed on port:
omt-ingestion(openmetadata/ingestion): An Airflow-based service dedicated to running metadata ingestion workflows. You configure and trigger these workflows from the OpenMetadata UI to connect to your data sources (like databases, dashboards, or messaging systems) and pull their metadata into the platform.- Airflow UI (for ingestion debugging) is on port:
8080
- Airflow UI (for ingestion debugging) is on port:
omt-db(postgresql): The primary metadata store. This PostgreSQL database persists all the metadata for your data assets, including schemas, descriptions, tags, ownership, lineage information, and data quality test results.omt-es(elasticsearch): The search engine that powers OpenMetadata's discovery features. It indexes all metadata to provide a fast, powerful search experience, allowing users to quickly find relevant data assets.omt-migrate(openmetadata/server): An initialization container that runs once upon the first startup. Its job is to prepare and migrate the PostgreSQL database schema to the version required by theomt-server, ensuring the application starts correctly.
- Empower data consumers (analysts, scientists, etc.) to find relevant and trusted data assets through a powerful, user-friendly search interface, regardless of where the data is physically located.
- Automatically ingest and visualize lineage from a wide range of sources (e.g., Flink, Spark, dbt, BI tools). This allows you to understand data dependencies, perform impact analysis for changes, and debug data issues from source to destination.
- Establish a Business Glossary with standardized definitions for key business terms.
- Assign clear ownership to data assets to promote accountability.
- Use Tags and Classifications to categorize data, identify sensitive information (PII), and enforce access policies.
- Define and schedule data quality tests directly within the OpenMetadata UI. Monitor the health and reliability of your most critical datasets over time and build trust in your data.
- Create a collaborative environment where users can enrich metadata with descriptions, comments, and documentation, turning tribal knowledge into a shared, durable asset for the entire organization.
Factor House Local Labs
Get a fast and practical start with our new Factor House Local labs. These hands-on labs provide detailed walkthroughs for building real-time data pipelines using Kafka, Flink, Spark, Iceberg, and Pinot.
Each lab is designed to be modular, hands-on, and production-inspired, helping you learn, prototype, and extend your data platform skills.
Mobile Game Top K Analytics
This project walks through how to build a complete real-time analytics pipeline for a mobile game using a modern data stack. It simulates live gameplay data, processes it in real time to calculate performance metrics, and displays the results on an interactive dashboard.
CDC with Debezium on Real-Time theLook eCommerce Data
This project unlocks the power of the popular theLook eCommerce dataset for modern event-driven applications. It uses a re-engineered real-time data generator that transforms the original static dataset into a continuous stream of simulated user activity, writing directly to a PostgreSQL database.
A Practical Guide to Data Lineage on Kafka Connect with OpenLineage
The lab demonstrates how to capture real-time data lineage from Kafka Connect using a custom Single Message Transform (SMT) - OpenLineageLifecycleSmt. It builds a complete pipeline that tracks data from a source connector to S3 and Iceberg sinks, with the full lineage graph visualized in Marquez.
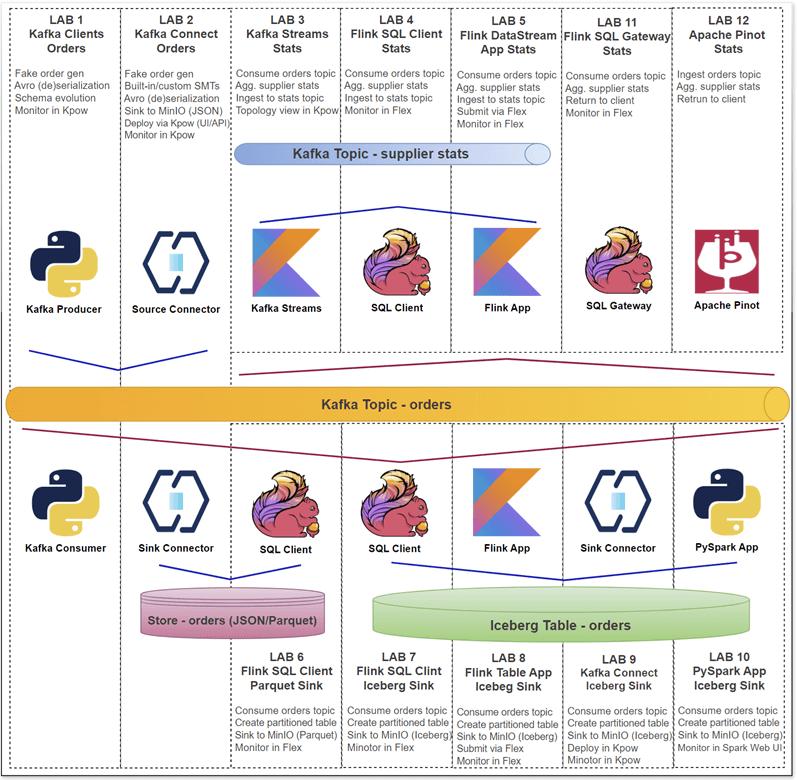
End-to-End Data Lineage from Kafka to Flink and Spark
An end-to-end tutorial for establishing data lineage across Kafka, Flink, Spark, and Iceberg. This lab begins by tracking data from a single Kafka topic through parallel pipelines: a Kafka S3 sink connector for raw data archival, a Flink job for real-time analytics, another Flink job for Iceberg ingestion, and a downstream Spark batch job that reads from the Iceberg table.
Stay tuned—more labs and projects are on the way!
The local cluster runs with Docker Compose, so you will need to install Docker.
Once Docker is installed, clone this repository and run the following commands from the base path.
git clone [email protected]:factorhouse/factorhouse-local.git
cd factorhouse-local
Core services like Flink, Spark, and Kafka Connect are designed to be modular and do not come bundled with the specific connectors and libraries needed to communicate with other systems like the Hive Metastore, Apache Iceberg, or S3.
setup-env.sh automates the process of downloading all the required dependencies and organizing them into a local deps directory. When the services are started with docker-compose, this directory is mounted as a volume, injecting the libraries directly into each container's classpath.
View all downloaded dependencies
- Confluent S3 Connector: For streaming data from Kafka to S3.
- Debezium PostgreSQL Connector: For capturing row-level changes from a PostgreSQL database.
- Amazon MSK Data Generator: A tool for generating sample data for testing.
- Iceberg Kafka Connect: For sinking Kafka records into Apache Iceberg tables.
- Kafka SQL Connector: Enables Flink to read from and write to Kafka topics using SQL.
- Avro Confluent Registry: Allows Flink to work with Avro schemas stored in Confluent Schema Registry.
- JDBC SQL Connector: A connector for reading data from and writing data into any relational databases with a JDBC driver.
- PostgreSQL JDBC Driver: A driver to connect to a PostgreSQL database.
- Hive SQL Connector: Allows Flink to connect to a Hive Metastore and query Hive tables.
- Supporting Libraries: Includes
Hive Exec,Antlr, andThriftlibraries necessary for the Hive integration to function.
- Iceberg Flink Runtime: The core library for Flink to read from and write to Apache Iceberg tables.
- Iceberg AWS Bundle: Provides AWS-specific integrations for Iceberg, like S3 file I/O.
- Parquet SQL Formatter: Enables Flink to handle the Parquet file format.
- Hadoop Libraries: A collection of core Hadoop modules (
hadoop-common,hadoop-aws,hadoop-auth) and their dependencies (aws-java-sdk-bundle,guava, etc.) required for interacting with HDFS-compatible file systems like S3. - PostgreSQL JDBC Driver: Required for the Hive Metastore to communicate with its PostgreSQL backend database.
- Iceberg Spark Runtime: The core library for Spark to read from and write to Apache Iceberg tables.
- Iceberg AWS Bundle: Provides AWS-specific integrations for Spark, enabling it to work with Iceberg tables on S3.
./resources/setup-env.sh
▶️  Downloading Kafka connectors...
⏳ Progress : [##################################################] 100%
✅ Download complete in 0m 27s!

▶️  Downloading Flink connectors...
⏳ Progress : [##################################################] 100%
✅ Download complete in 0m 4s!

▶️  Downloading Flink Hive dependencies...
⏳ Progress : [##################################################] 100%
✅ Download complete in 0m 11s!

▶️  Downloading Flink Iceberg/Parquet dependencies...
⏳ Progress : [##################################################] 100%
✅ Download complete in 0m 12s!

▶️  Downloading Hadoop/Hive Metastore dependencies...
⏳ Progress : [##################################################] 100%
✅ Download complete in 0m 36s!

▶️  Downloading Spark Iceberg/OpenLineage dependencies...
⏳ Progress : [##################################################] 100%
✅ Download complete in 0m 14s!Both Kpow and Flex require valid licenses. Licenses can be obtained from the Factor House License Portal. Visit https://account.factorhouse.io/auth/getting_started to generate your license.
You can begin with either of the following options:
- Request a free Community License for non-commercial use. A single community license now covers both Kpow and Flex.
- Request a 30-day Trial License for commercial evaluation, providing full access to all enterprise features.
For managing Kpow and Flex licenses effectively, it's strongly recommended to store the license files externally from your main configuration or version control system (like Git). This approach prevents accidental exposure of sensitive license details and makes updating or swapping licenses much simpler.
The Docker Compose files facilitates this by allowing you to specify the path to your license file using environment variables on your host machine before launching the services. Specifically, they are configured to look for these variables and use their values to locate the appropriate license file via the env_file directive. If an environment variable is not set, a default path (usually within the resources directory) is used as a fallback.
Factor House Community licenses can be used across both Flex and Kpow, however individual trial licenses are required for evaluation. To enforce consistency, Kpow and Flex both require the license variable to be set on a product-by-product basis, regardless of which license you're using (this also applies to enterprise license configurations).
Therefore, you should specify the path to your license file for both environment variables:
KPOW_LICENSE: Specifies the path to the Kpow license file.FLEX_LICENSE: Specifies the path to the Flex license file.
Example Usage:
Imagine your Kpow license is stored at /home/<username>/.factorhouse/kpow-license.env. To instruct Docker Compose to use this specific file, you would set the environment variable on your host before running the compose command:
# Set the environment variable (syntax may vary slightly depending on your shell)
export KPOW_LICENSE=/home/<username>/.factorhouse/kpow-license.env

# Now run Docker Compose - it will use the path set above
docker compose -p kpow -f compose-kpow.yml up -d
By default, it is configured to deploy the Enterprise edition. See below for instructions on how to configure it to run the Community edition instead.
License file example
LICENSE_ID=<license-id>
LICENSE_CODE=<license-code>
LICENSEE=<licensee>
LICENSE_EXPIRY=<license-expiry>
LICENSE_SIGNATURE=<license-signature>
License mapping details
# compose-kpow.yml
services:
  kpow:
    ...
    env_file:
      - resources/kpow/config/trial.env
      - ${KPOW_LICENSE:-resources/kpow/config/license.env}

# compose-flex.yml
services:
  flex:
  ...
  env_file:
    - resources/flex/config/trial.env
- ${FLEX_LICENSE:-resources/flex/config/license.env}To get the platform running, you first need to configure your local environment. This involves setting environment variables to select the edition you want to run (Community or Enterprise) and providing the file paths to your licenses. Once these prerequisites are set, you can launch the services using docker compose. You have two primary options: you can start all services (Kpow, Flex, and Pinot) together for a fully integrated experience, or you can run Kpow and Flex independently for more focused use cases. When you are finished, remember to run the corresponding down command to stop and remove the containers, and unset the environment variables to clean up your session.
Before running any commands, configure your shell environment by uncommenting and setting the following variables in your terminal.
# --- Configuration ---

# Edition (choose one by uncommenting the lines)
# For Enterprise Edition:
# unset KPOW_SUFFIX
# unset FLEX_SUFFIX

# For Community Edition:
# export KPOW_SUFFIX="-ce"
# export FLEX_SUFFIX="-ce"

# Licenses (provide the path to your license .env files)
# export KPOW_LICENSE="/path/to/your/kpow-license.env"
# export FLEX_LICENSE="/path/to/your/flex-license.env"This platform is designed to be modular. You can run each stack individually or combine them to create a complete, integrated environment.
Before you start, understand these three concepts:
- Project Isolation (
-p <name>): We use the-pflag (e.g.,-p kpow) to give each stack a unique project name. This prevents Docker from getting confused if multiple files define a service with the same name (like a database). - Stack Profiles (
--profile): Files likecompose-store.ymlandcompose-obsv.ymlcontain multiple, independent services. The--profileflag lets you choose which one to activate (e.g.,--profile pinot). - Shared Network (
USE_EXT): By default, thecompose-kpow.ymlstack creates a shared Docker network calledfactorhouse. Other stacks are designed to connect to this network so services can communicate.- If you run a stack without the
kpowstack, you must tell it to create its own network. This is done by settingUSE_EXT=false.
- If you run a stack without the
While you can launch all services together, the most common and resource-friendly approach is to launch only the stacks you need.
1. Kafka & Kpow Stack
This is the foundational stack. It creates the shared factorhouse network that other stacks can connect to.
# Start
docker compose -p kpow -f ./compose-kpow.yml up -d

# Stop
docker compose -p kpow -f ./compose-kpow.yml down
2. Flink & Flex Stack
- To run with the Kafka stack (recommended):
docker compose -p flex -f ./compose-flex.yml up -d
- To run standalone (creates its own network):
USE_EXT=false docker compose -p flex -f ./compose-flex.yml up -d
- To stop:
# Note: Use USE_EXT=false here as well if you started it standalone
docker compose -p flex -f ./compose-flex.yml down
3. Real-Time Data Stores (Pinot, ClickHouse, StarRocks)
These are selected from compose-store.yml via profiles.
💡 You can specify multiple profiles to launch more than one data store at once, e.g.,
--profile pinot --profile clickhouse.
# Start Apache Pinot (connected to the factorhouse network)
docker compose -p store --profile pinot -f ./compose-store.yml up -d

# Stop Apache Pinot
docker compose -p store --profile pinot -f ./compose-store.yml down

# Start ClickHouse (connected to the factorhouse network)
docker compose -p store --profile clickhouse -f ./compose-store.yml up -d

# Stop ClickHouse
docker compose -p store --profile clickhouse -f ./compose-store.yml down

# Start StarRocks (connected to the factorhouse network)
docker compose -p store --profile starrocks -f ./compose-store.yml up -d

# Stop StarRocks
docker compose -p store --profile starrocks -f ./compose-store.yml down
4. Observability Stacks (Lineage & Telemetry)
These are selected from compose-obsv.yml using profiles.
# Start Marquez for data lineage (connected to the factorhouse network)
docker compose -p obsv --profile lineage -f ./compose-obsv.yml up -d

# Stop Marquez
docker compose -p obsv --profile lineage -f ./compose-obsv.yml down

# Start all observability services (Lineage + Telemetry)
docker compose -p obsv --profile lineage --profile telemetry -f ./compose-obsv.yml up -d

# Stop all observability services
docker compose -p obsv --profile lineage --profile telemetry -f ./compose-obsv.yml down
5. Metadata Stack
This is selected from compose-metadata.yml.
# Start OpenMetadata (connected to the factorhouse network)
docker compose -p metadata --profile omt -f ./compose-metadata.yml up -d

# Stop OpenMetadata
docker compose -p metadata --profile omt -f ./compose-metadata.yml downAfter stopping the services, run this command to unset the environment variables from your terminal session.
unset KPOW_SUFFIX FLEX_SUFFIX KPOW_LICENSE FLEX_LICENSEThe enterprise editions of Kpow and Flex support multiple authentication providers, as outlined in the documentation below:
Among those, this project includes file-based authentication, and user credentials can be found in the following locations:
For demonstration purposes, Kpow and Flex can be accessed using admin as both the username and password.

After successful authentication, users are redirected to the Overview page.

The following sections show key services and their associated port mappings.
| Service Name | Port(s) (Host:Container) | Description |
|---|---|---|
kpow |
3000:30004000:4000 |
Kpow Web UI (3000)Kpow API ( 4000) |
schema |
8081:8081 |
Confluent Schema Registry (manages Kafka message schemas). |
connect |
8083:8083 |
Kafka Connect (framework for Kafka connectors). |
kafka-1 |
9092:9092 |
Kafka Broker 1 (primary listener). |
kafka-2 |
9093:9093 |
Kafka Broker 2 (primary listener). |
kafka-3 |
9094:9094 |
Kafka Broker 3 (primary listener). |
| Service Name | Port(s) (Host:Container) | Description |
|---|---|---|
flex |
3001:3000 |
Flex UI for enterprise Flink management and monitoring. |
jobmanager |
8082:8081 |
Apache Flink JobManager UI & REST API. |
sql-gateway |
9090:9090 |
Apache Flink SQL Gateway for submitting interactive SQL queries. |
spark |
4040:404018080:18080 |
Spark Web UI (4040).Spark History Server ( 18080). |
minio |
9001:90019000:9000 |
MinIO Console UI (9001).MinIO S3-compatible API ( 9000). |
postgres |
5432:5432 |
PostgreSQL database, used as the Hive Metastore backend. |
hive-metastore |
9083:9083 |
Apache Hive Metastore service. |
redis |
6379:6379 |
Redis in-memory data store. |
__(Note: Services like taskmanager-_andmc run in the background and do not expose ports to the host.)_*
These services are launched from compose-store.yml using profiles.
| Service Name | Port(s) (Host:Container) | Description |
|---|---|---|
zookeeper |
2181:2181 |
ZooKeeper (coordination service, required for Pinot). |
pinot-controller |
19000:9000 |
Apache Pinot Controller (manages cluster state, UI/API). |
pinot-broker |
18099:8099 |
Apache Pinot Broker (handles query routing). |
pinot-server |
18098:8098 |
Apache Pinot Server (hosts data and executes queries). |
| Service Name | Port(s) (Host:Container) | Description |
|---|---|---|
ch-app |
8000:80008084:8080 |
HyperDX API (8000).HyperDX Web UI ( 8084). |
ch-server |
8123:812329000:9000 |
ClickHouse Server HTTP API (8123).Native TCP client ( 29000). |
| Service Name | Port(s) (Host:Container) | Description |
|---|---|---|
starrocks-fe |
8030:80309030:9030 |
StarRocks Frontend UI (8030)MySQL SQL client ( 9030). |
These services are launched from compose-obsv.yml using profiles.
| Service Name | Port(s) (Host:Container) | Description |
|---|---|---|
marquez-web |
3003:3000 |
Marquez Web UI (visualizes OpenLineage data). |
marquez-api |
5002:5000 |
Marquez backend and OpenLineage API endpoint. |
marquez-db |
5433:5432 |
PostgreSQL database for Marquez metadata. |
| Service Name | Port(s) (Host:Container) | Description |
|---|---|---|
prometheus |
19090:9090 |
Prometheus (metrics collection and database). |
alertmanager |
19093:9093 |
Alertmanager (handles alerts from Prometheus). |
grafana |
3004:3000 |
Grafana (platform for metrics visualization & dashboards). |
These services are launched from compose-metadata.yml using the --profile omt flag.
| Service Name | Port(s) (Host:Container) | Description |
|---|---|---|
omt-server |
8585:8585 |
OpenMetadata Web UI and central API. |
omt-ingestion |
8080:8080 |
Airflow UI for managing metadata ingestion workflows. |
omt-es |
9200:9200 |
Elasticsearch (powers the search and discovery features). |
omt-db |
5434:5432 |
PostgreSQL database for the OpenMetadata backend. |
The Flink services (jobmanager, taskmanager, and sql-gateway) do not have their dependencies baked into the Docker image. Instead, all required JAR files are dynamically loaded at runtime using a combination of Docker volume mounts and a Flink classpath discovery mechanism.
Dependencies for Hadoop, Hive, Iceberg, and Parquet are first downloaded to the local ./resources/deps directory on the host machine. These directories are then mounted as volumes directly into the Flink containers at specific paths (e.g., /tmp/hadoop, /tmp/iceberg).
The Flink runtime is then instructed to scan these directories by the CUSTOM_JARS_DIRS environment variable. This variable contains a semicolon-separated list of paths ("/tmp/hadoop;/tmp/hive;/tmp/iceberg;/tmp/parquet") that Flink will automatically search for JARs to add to its classpath upon startup.
However, the SQL Gateway has a special requirement. In addition to the standard dependencies, it needs access to specific Flink SQL connectors (like Kafka, Avro, etc.) which are mounted into the /tmp/connector directory. Since the SQL Gateway does not support custom JAR loading through its own configuration, the CUSTOM_JARS_DIRS environment variable for this specific service must be updated to include this path. This ensures the Gateway can successfully load the connectors required to execute SQL queries against external systems.
...

x-common-environment: &flink_common_env_vars
  AWS_REGION: us-east-1
  HADOOP_CONF_DIR: /opt/flink/conf
  HIVE_CONF_DIR: /opt/flink/conf
  CUSTOM_JARS_DIRS: "/tmp/hadoop;/tmp/hive;/tmp/iceberg;/tmp/parquet" # <-- Add ;/tmp/connector for SQL Gateway

x-common-flink-volumes: &flink_common_volumes
  ...
  - ./resources/deps/hadoop:/tmp/hadoop
  - ./resources/deps/flink/hive/flink-sql-connector-hive-3.1.3_2.12-1.20.1.jar:/tmp/hive/flink-sql-connector-hive-3.1.3_2.12-1.20.1.jar
  - ./resources/deps/flink/hive/antlr-runtime-3.5.2.jar:/tmp/hive/antlr-runtime-3.5.2.jar
  - ./resources/deps/flink/iceberg:/tmp/iceberg
  - ./resources/deps/flink/parquet:/tmp/parquet
  - ./resources/deps/flink/connector:/tmp/connector

services:
  ...
  jobmanager:
    <<: *flink_image_pull_policy_config
    container_name: jobmanager
    command: jobmanager
    ...
    environment:
      <<: *flink_common_env_vars
    volumes: *flink_common_volumes
PyFlink is supported by setting the FLINK_SUFFIX environment variable before launching the services.
By exporting export FLINK_SUFFIX="-py", you instruct Docker Compose to modify its build process for the Flink services. This change directs it to use the resources/flink/Dockerfile-py file instead of the default one. During the image build, this specific Dockerfile extends the base Flink image by installing Python, pip, and the apache-flink Python package.
As a result, the jobmanager and taskmanager containers will be fully equipped with the necessary environment to develop and execute PyFlink jobs. You can inspect the Dockerfile-py for the exact commands used.
You can also build the image before starting the Docker service by
docker build -t fh-flink-1.20.1${FLINK_SUFFIX:-} ./resources/flink
x-common-flink-config: &flink_image_pull_policy_config
  image: fh-flink-1.20.1${FLINK_SUFFIX:-} # ${FLINK_SUFFIX} is either unset (blank) or -py
  build:
    context: ./resources/flink/
    dockerfile: Dockerfile${FLINK_SUFFIX:-}
  pull_policy: never

...

services:
  ...
  jobmanager:
    <<: *flink_image_pull_policy_config
    container_name: jobmanager
    command: jobmanager
    ...
    environment:
      <<: *flink_common_env_vars
    volumes: *flink_common_volumes
Alternatively, you can build the image manually before starting the services. This gives you more control and can speed up subsequent launches. To do this, run the docker build command from your terminal, making sure the tag (-t) exactly matches the image name specified in the docker-compose.yml file.
To build the PyFlink image:
# Set the suffix for the tag and Dockerfile name
export FLINK_SUFFIX="-py"

# Build the image
docker build \
  -t fh-flink-1.20.1${FLINK_SUFFIX} \
  -f ./resources/flink/Dockerfile${FLINK_SUFFIX} \
  ./resources/flink
Because the image is now built and tagged locally, docker compose up will use it directly instead of attempting to build it again.
Any issues? Contact support or view our docs.
This repository is released under the Apache 2.0 License.
Copyright © Factor House.